- Global renewable energy sector employed 9.8 million people in 2016. This is an increase by 1.1% over 2015. Jobs in renewables increased by 2.8% to reach 8.3 million in 2016.
- China, Brazil, the United States, India, Japan and Germany accounted for most of the renewable energy jobs.
- Solar photovoltaic was the largest employer, with 3.1 million jobs, up 12% from 2015. The growth came mainly from China, the United States and India, whereas jobs decreased for the first time in Japan, and continued to decline in the European Union.
- New wind installations in the United States, Germany, India and Brazil contributed to a 7% increase in global wind employment, which reached 1.2 million jobs.
- Liquid biofuels (1.7 million jobs), solid biomass (0.7 million) and biogas (0.3 million) were also major employers, with jobs concentrated in feedstock supply. Brazil, China, the United States and India were key bioenergy job markets.
- Jobs in solar heating and cooling declined 12% to 0.8 million amid an installation slowdown in major markets such as China, Brazil and the European Union.
- Large hydropower employed 1.5 million people (direct jobs), with around 60% of those in operation and maintenance. Key job markets were China, India, Brazil, the Russian Federation and Viet Nam.
- Gender discrimination in renewable energy employment seems less pronounced than in the energy sector at large. However, challenges to employment and promotion remain. To understand regional dynamics, IRENA, BNEF, and CEBC conducted a survey in the Middle East and North Africa (MENA) region to identify the barriers to entry as well as actions to address gender discrimination in the clean energy labour markets. Actions include: mentorship and training, support for parenting, fair and transparent processes, and targets for diversity.
SOURCE: IRENA, 2017. Renewable Energy and Jobs. Annual Review 2017.
Worldwide Job Increase In the Renewable Energy Sector – Employment Prospects in France in the Biogas Sector  Source: IRENA, 2016
 Source: IRENA, 2016
Experiences from Germany
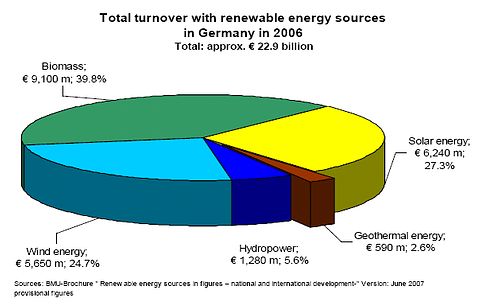
A recent study by the German government looked at the employment effects of the renewable energy market in Germany. In the renewable energy sector as a whole, Germany saw an increase in FTE RE jobs from 157,000 to 214,000 between 2004 and 2006 (representing a 36% increase over the previous year, and a 50% increase since 2004). In the biomass sector, the increase has been even greater from 57,600 to 91,900 in the same time period, which is a 59% increase. In this 2 year period the biomass sector has eclipsed wind energy in terms of full time equivalent jobs. The graph below shows that biomass is a lucrative business in Germany, reaping 9.1€ billion, which represents 40% of all renewable energy turnover in 2006.
To download the report click here.
Employment Figures for Developing Countries
The employment as report from Domic, J. et al (2005) “Socio-economic drivers in Implementing Bioenergy Projects”, Biomass & Bioenergy, shows the importance of bioenergy in developing countries. The objective is to increase the efficiency of this biomass utilisation, with better technology and application so they get the most out of the biomass available and to grow biomass at a sustainable rate which is not overtaken by consumption.
|
Country |
Estimated Employment |
Description and Nature of Employment |
| Pakistan | 600,000 | Many are involved in production, conversion, and transportation. Ratio between traders and gatherers is 1:5 |
| India | 3-4 million | The woodfuel trade is the largest source of employment in the energy sector |
| Philippines | 700,000 (production) 140,000 (trade) | Biomass energy production and trade |
| Brazil | 700,000 | Ethanol Industry |
| 200,000 | Charcoal Industry | |
| Kenya and Cameroon | 30,000 | Charcoal production only |
| Ivory Coast | 90,000 | Charcoal production only |
Proportion of Earnings by Activity
The follow graphs show the difference the Earnings for each activity of the bioenergy cycle in developing or tropical countries. The figures come from Hector, B., 2000, “Forest fuels-rural employment and earnings”, Department of Forest Management and Products, SLU, SE-750 07, Upsala, Sweden. Depending on the type of bioenergy chain, the different activities vary quite considerably. For example administration costs account for 10% of intensive farming total costs whereas in large-scale woodfuel forestry it accounts for 23% of total cost. Also harvesting agricultural land is proportionally more costly than forestry with figures of 36% and 25% respectively. Many factors influence the differences, not just the physical differences in the biomass, between food crops and trees such as density, weight and bulk size but also the size of the estate, whether harvesting equipment is affordable for smaller producers.

European Commission BAP: Employment in figures
European Commission figures:
The Biomass Action Plan (BAP) from December 2005, released a number of figures and targets for biomass in Europe. Among these figures were the employment opportunities from the bioenergy sector, where it reported the potential in 2010 of 267,175 FTE (full time equivalent) positions if the BAP strategies were followed in earnest. The BAU (Business as usual) estimate reported total FTE employment to arrive at only 84,450 by 2010. The employment potential is mostly expected to take place in rural regions which will benefit often slow economic development which is typical of these regions. The graph below shows the difference between biomass development today (with low governmental support) and the potential employment described in the Biomass Action Plan. In order to meet the 2010 and 2020 biofuel targets, the liquid biofuel industry must progress as strongly as the BAP potential suggests in the graph.

Employment benefits
Bioenergy is a decentralised energy option whose implementation presents positive impacts on rural development by creating business and employment opportunities. Jobs are created all along the bioenergy chain, from biomass production or procurement, to its transport, conversion, distribution and marketing. Bioenergy appears as the most labour-intensive sector among renewables. The jobs created range from manual ones to specialised engineering and administration positions. Through liquid biofuels, bioenergy can also offer agriculture an opportunity to diversify its market outcomes.
From the perspective of bioenergy projects, the term employment usually includes three different categories. Direct employment results from operation, construction and production. In the case of bioenergy systems, this refers to the total labour necessary for crop production, construction, operation and maintenance of conversion plants, and for the transportation of biomass. Indirect employment is jobs generated within the economy as a result of expenditures related to biomass fuel cycles. Indirect employment results from all activities connected, but not directly related, such as supporting industries, services and similar. The higher purchasing power, due to increased earnings from direct and indirect jobs may also create opportunities for new secondary jobs, which may attract people to stay or even to move in. These latter effects are referred to as induced employment. The main issue is whether the bioenergy project will provide earnings that are high enough for long enough to make it worthwhile to mobilise local resources for implementation.
To top
An estimate of the employment effect of forest chips production in Finland by 2010
|
Product |
Production |
Man.years/ |
Man.years/ |
| Small tree chips |
|
|
|
| – whole tree chips, mechanised cutting |
600 |
0.60 |
360 |
| – whole tree chips, manual cutting |
200 |
1.20 |
240 |
| – stemwood chips, self-employed forest owners |
200 |
2.00 |
400 |
| Logging residues chips |
2500 |
0.30 |
750 |
| Stump chips |
1500 |
0.35 |
525 |
| Forest chips, total |
5000 |
0.45 |
2275 |
Source: VTT, 2004
Employment per PJ annual fuel consumption among selected European projects
| Biomass source/ technology |
MWth |
Direct jobs |
Indirect jobs |
Induced jobs |
Total jobs |
Multiplier |
Country |
| SRC, gasifier |
2 |
51 |
11 |
36 |
98 |
1.25 |
United Kingdom |
| Miscanthus, heat |
0.13 |
321 |
0 |
214 |
534 |
1.21 |
Belgium |
| Forest residues, CHP |
40 |
52 |
33 |
30 |
115 |
1.30 |
France |
| Triticale, proc. Heat |
2 |
134 |
60 |
28 |
222 |
1.33 |
Germany |
| Artichoke, heat |
1 |
269 |
19 |
93 |
380 |
1.50 |
Greece |
| SRC, gasifier |
5 |
36 |
21 |
23 |
80 |
1.29 |
Ireland |
| Ind. Residues, CHP |
17 |
41 |
11 |
13 |
65 |
1.46 |
Italy |
| Waste etc. CHP |
5 |
13 |
2 |
27 |
42 |
1.18 |
The Netherlands |
| Logging Residues, heat |
10 |
52 |
2 |
21 |
76 |
1.26 |
Sweden |
Source: IEA, 2003
To top
An ALTENER study carried out in 1998-99 evaluated and quantified the employment and economic benefits of renewable energy in the EU. The study was initiated by the European Forum for Renewable Energy Sources (EUFORES) and carried out by a consortium of organisations led by ECOTEC Research and Consulting Ltd. It provided a complete analysis of employment impacts from renewable energy (including bioenergy) taking into account jobs created both directly and indirectly as more renewable plants are manufactured, installed and operated. It also considered jobs displaced in conventional (fossil or nuclear) energy plants, or jobs lost because of subsidies provided to renewables that could otherwise fund employment in other sectors of the economy. Highlights derived from the conclusions were that the use of renewable energy technologies will more than double by 2020 and will lead to the creation of about 900,000 jobs by 2020. More than 90% of these jobs (approximately 840,000) will be in the bioenergy sector and 500,000 of them in the agricultural industry in order to provide primary biomass fuels.
Impact of renewable technologies on employment in the European Union (new net jobs FTE employment relative to base in 1995)
| Technology |
2005 |
2010 |
2020 |
| Bioenergy |
449,928 |
642,683 |
838,780 |
| – Energy crops and residues, forest residues |
307,641 |
416,538 |
515,364 |
| – Bio-anaerobic |
37,223 |
70,168 |
120,285 |
| – Bio-thermal |
94,164 |
123,608 |
154,422 |
| – Liquid biofuels |
10,900 |
32,369 |
48,709 |
| Solar thermal heat |
4590 |
7390 |
14, 311 |
| PV |
479 |
-1769 |
10,231 |
| Solar thermal electric |
593 |
649 |
621 |
| Wind onshore |
8690 |
20,822 |
35,211 |
| Wind offshore |
530 |
-7968 |
-6584 |
| Small hydro |
-11,391 |
-995 |
7977 |
| TOTAL |
453,418 |
660,812 |
900,546 |
Source: IEA, 2003 (from the ECOTEC study “The impact of renewables on employment and economic growth. Directorate General for Energy, European Commission, 1999.)
To top
Bioenergy employment in the EU (new net jobs FTE employment relative to base in 1995)

For more information about bioenergy and employment
IEA Bioenergy Task 29 “Socio-economic drivers in implementing bioenergy projects”
http://www.iea-bioenergy-task29.hr/